Introduction
Nucleic Acid Therapeutics (NATs), including antisense oligonucleotides (ASOs), splice-switching oligos, siRNAs and their conjugates act inside cells in tissue, not in plasma, so interpreting their pharmacology depends on measuring tissue concentrations of the intact drug in the presence of chain-shortened metabolites. This review covers the hybridization assay formats in current use, the chemistry that gives each one its selectivity, and what each one cannot see. Two formats dominate in practice — hybridization–ligation and the enzyme-free sandwich assays — which are now often read out by electrochemiluminescence. We explain why that platform change widened the working range, where the remaining blind spots are, and how splint-ligation PCR and hybridization-coupled mass spectrometry cover them.
1. Why tissue is a different measurement
Systemically administered oligonucleotides clear from circulation in hours but persist in tissue for weeks. The FDA’s 2024 guidance states the consequence plainly: “for some oligonucleotide therapeutics, systemic pharmacokinetics might not reflect the target tissue distribution, pharmacodynamics, safety, or efficacy”.[1] Three properties of tissue make the measurement difficult:
A metabolite ladder is always present. Nucleases shorten the chain from the termini, predominantly the 3′ end, generating n-1, n-2 and shorter species that coexist with parent in every sample [2]. Terminal 2′-modified wings slow this but do not stop it. The nuclease activity is strongly tissue-dependent. In non-human primate liver, a modified siRNA antisense strand was 71.3% intact with 21.5% 3′ n-1, while in kidney the same analyte was 90.7% intact with 9.3% n-1 and nothing shorter detectable.[3]
Phosphorothioate oligonucleotides bind protein avidly. Jepp spiked ASO into mouse brain homogenate either immediately after disruption or after processing was complete and recovered roughly 15-fold more in the post-processed samples because the analyte partitions to proteins that are discarded after centrifugation.[4] Standards must be spiked into unprocessed homogenate and carried through the identical workflow. This single point invalidates more tissue data than any other.
Tissues differ from one another more than plasma lots do. Yuan found 1:12.5 homogenization insufficient to normalize eight tissue types and had to dilute to 1:37.5 before accuracy and precision were acceptable across all of them.[5] Jepp generated curves in 16 non-human primate CNS regions and had to sort them into three groups before pooled standards could be used.[4]
2. Hybridization formats in Ligand Binding Assays
The use of sandwich hybridization for detecting nucleic acid analytes is not new. Ranki described the use of sandwich hybridization in 1983 for detecting adenovirus DNA in crude extracts. The same strategy is still used: an immobilized capture probe binds one half of the ASO and the other half binds the labeled detection probe.[6] Everything since then is the addition of steps to improve discrimination. Shown in Fig. 1 are the different categories of hybridization formats.
In 2002, Yu and her colleagues at Ionis Pharmaceuticals (formally ISIS) were the first to utilize a ligation step to select against n-1mers and other shortmers from the full-length ASO.[7] Yu’s breakthrough was to use T4 DNA ligase to seal the nick between the ASO’s 3′-hydroxyl and the short (9mer) reporter probe’s 5′-phosphate. The 3′-hydroxyls of ASO n-1mers, no longer adjacent to the 5′ phosphate, fail to ligate to the reporter probe and the short reporter probe is removed during a subsequent stringent wash step.
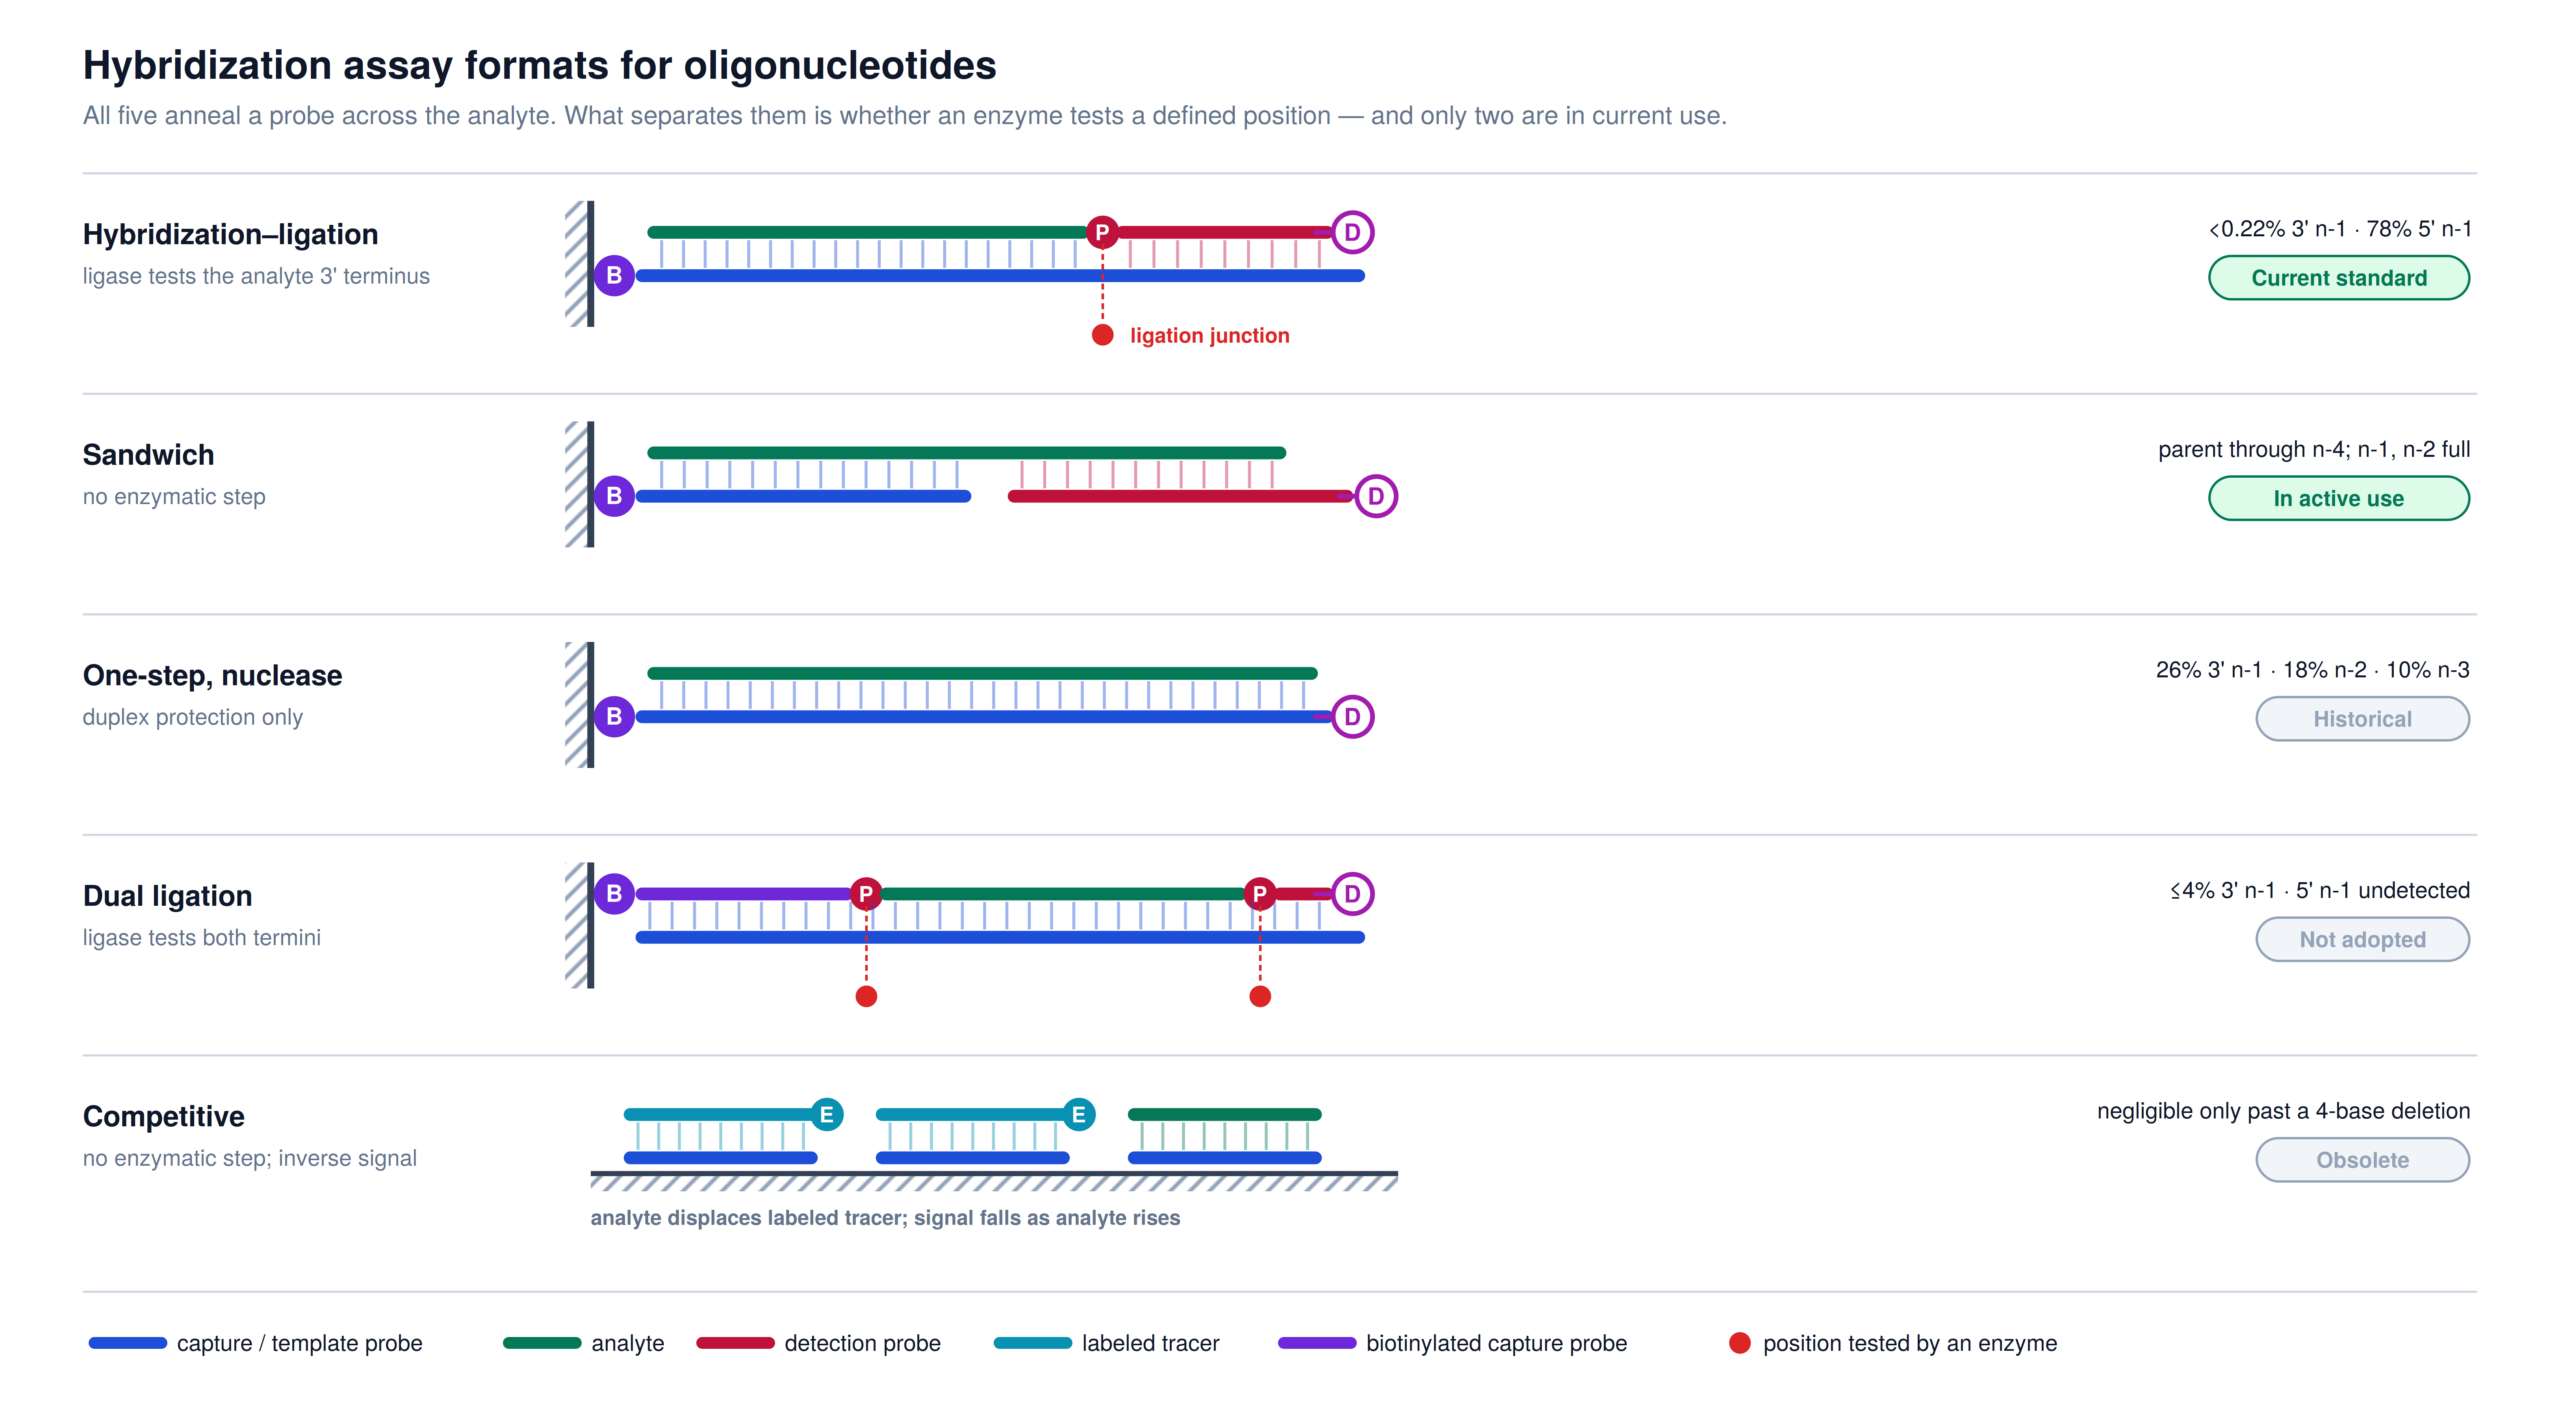
Yu’s hybridization–ligation assay reached a Lower Limit of Quantification (LLOQ) of 0.05 nM from 100 µL of plasma — 5 fmol absolute — with 3′-metabolite cross-reactivity below 0.22%. Prior to her work, the available competitive hybridization assays were limited to quantification at 1–4 nM and chromatographic and electrophoretic methods reached only >10 nM. A twenty- to eighty-fold sensitivity gain together with a step change in selectivity is why competitive hybridization assays are no longer widely used.
Xiaohui Wei and colleagues further refined the hybridization-ligation assay. They found there was nonspecific binding of the detection probe and theorized that the capture probe could bind the detection probe that carried the digoxigenin label, generating signal with no analyte present at all. Wei’s solution was an elegant one — prior to the wash step, treat with S1 nuclease.[8] S1 nuclease cuts single-stranded nucleic acids including bulges and loops. So, if there is an aberrant ligation, the bulge is cleaved. If there’s nonspecific binding of the detection probe to the avidin-coated well, it too is cleaved. This simple treatment reduced cross-reactivity with the n-1 metabolites twelve-fold and increased the calibrated range five-fold.[8]
Shown in Table 1 are the five broad hybridization formats which appear in the literature with their prevalence, selectivity to 3′ and 5′ n-1mers, and their prevalence in the field.
| Format | Discrimination event | Cross-reactivity and references | Status |
|---|---|---|---|
| Hybridization–ligation (+ S1 nuclease) | ligation at the 3′ terminus of the analyte | <0.22% 3′ n-1; 78% 5′ n-1; [7], [8] | Current standard |
| Sandwich | none | ≈ 100% n-1, n-2; reduced >n-4; [9], [10] | In active use |
| One-step, S1 nuclease | duplex protection only | 26% 3′ n-1, 18% n-2, 10% n-3; [8] | Historical |
| Dual ligation | ligation at both termini | ≤4% 3′ n-1; 5′ n-1 undetected; [11] | Not widely adopted |
| Competitive | none | negligible only past a 4-base deletion; [12] | Obsolete |
Dual ligation, developed by Thayer, provides discrimination of n-1mers at both the 5′ and 3′ termini of the ASO. T4 polynucleotide kinase is used to phosphorylate the analyte’s 5′-hydroxyl in situ to allow ligation events at the analyte’s 3′ and 5′. However, the sensitivity drops by an order of magnitude and — counterintuitively — its 3′ discrimination is substantially reduced compared to the single-junction ligation assay.[11]
3. The current standard: ligation, nuclease treatment and probe modifications
The current standard, shown in Fig. 2, is the use of hybridization-ligation using a biotinylated capture probe followed by treatment with S1 nuclease. The capture probe is immobilized on a streptavidin-coated well and has a nine-base 5′ overhang. The analyte anneals to the capture probe and the 5′-phosphorylated detection probe anneals to the overhang. T4 DNA ligase joins them — but only when the analyte is full-length such that the 3′ hydroxyl is adjacent to the 5′ of the detection probe and is correctly base-paired [7]. Any 3′-n-1 metabolites leave a one-nucleotide gap, preventing ligation.
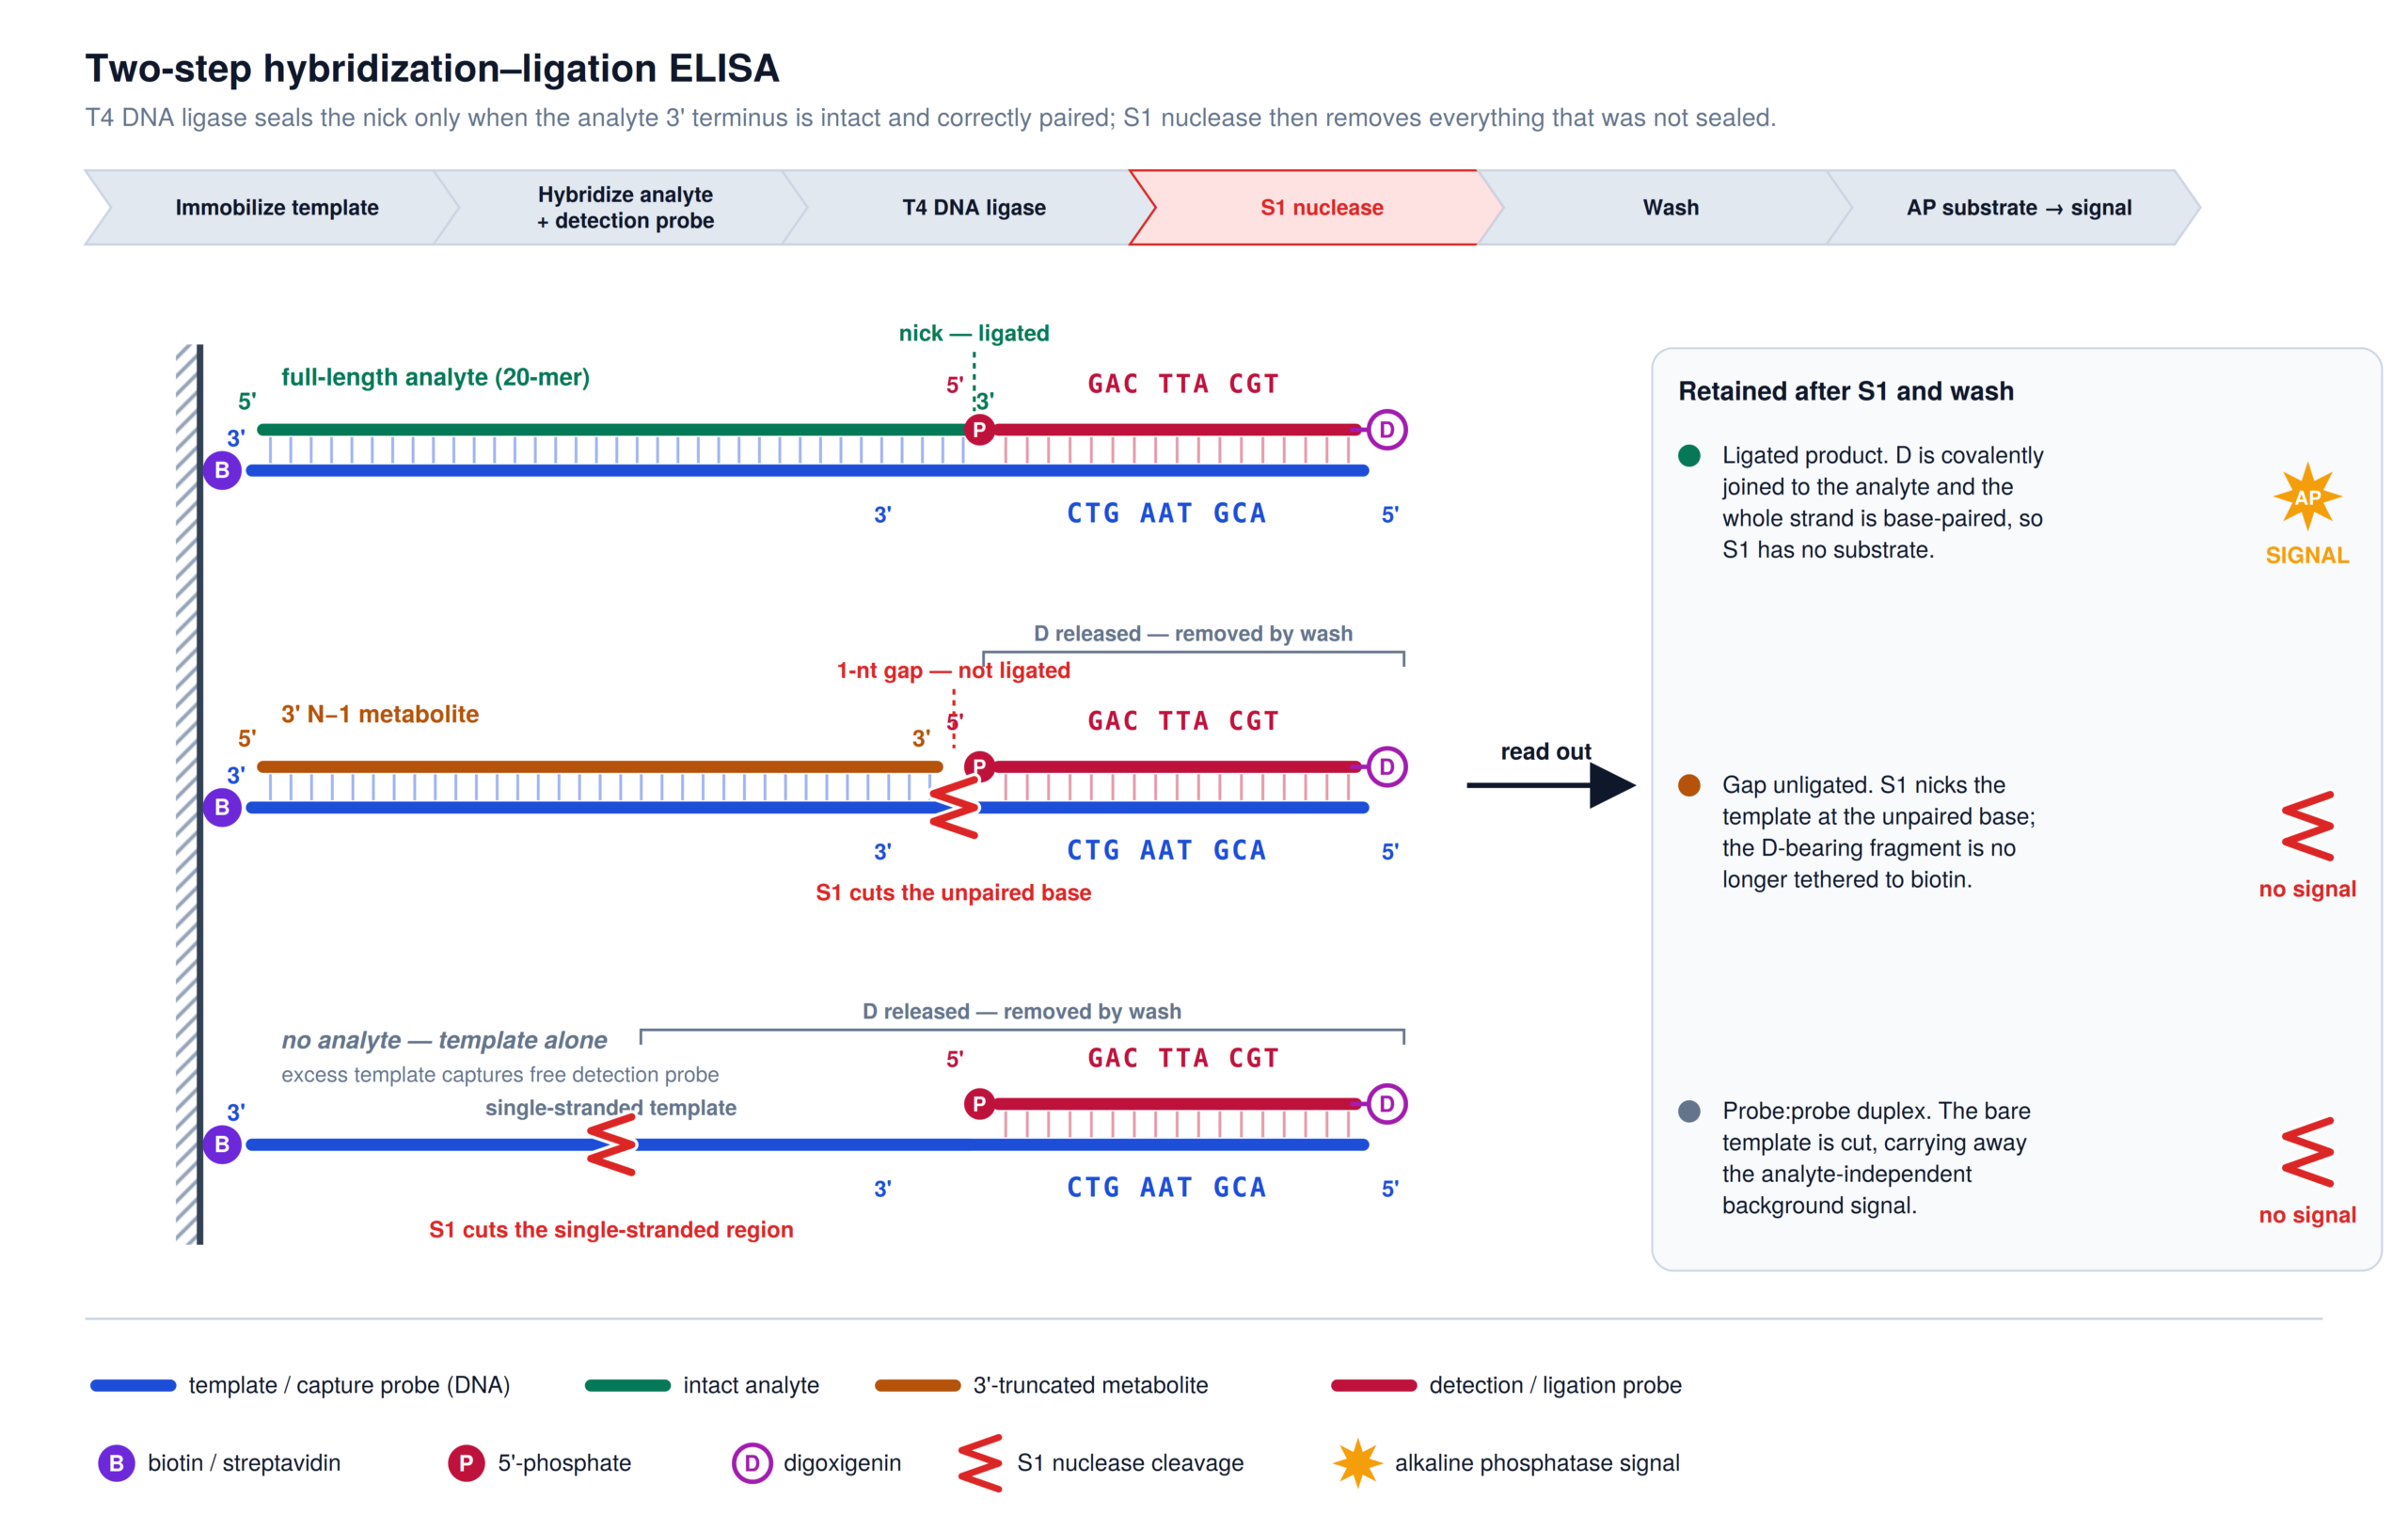
Yu’s format relied on a stringent wash to remove unligated detection probe. Wei showed the wash can be incomplete: in some cases the capture probe binds the detection probe directly, generating signal when no analyte is present.[8] Treating with S1 nuclease before the wash cuts both the unpaired base at an unligated gap and at single-stranded regions of the complex. For a 20-mer phosphorothioate ASO the effect is decisive as shown in Table 2.
| S1 nuclease | 3′ n-1 cross-reactivity | Parent signal loss |
|---|---|---|
| 0 U/well | 89% | — |
| 15 U/well | 15% | 2.2% |
| 30 U/well | 11% | 5% |
| 60 U/well | 7.8% | 7% |
| 100 U/well | 8.3% | 11% |
About 7% of parent signal buys a twelve-fold improvement in 3′ selectivity. Another critical finding in Wei’s paper was the source of a persistent calibration non-linearity — it was found that plasma proteins were interfering with hybridization and the non-linearity was corrected by the addition of 0.25% Triton X-100.[8]
Probe modifications. Thayer substituted locked nucleic acid into both capture and detection probes, raising affinity enough to cut working concentrations from 200 nM to 50 nM (capture) and 100 nM to 1 nM (detection), and reached a 1.0 pM detection limit in rat serum, rat liver homogenate and non-human primate liver and kidney — the same limit in solid tissue as in serum, which no earlier format achieved [3]. Total assay time fell from 48 h to 4 h.
The cost is selectivity. The same assay quantifies 3′ n-1 at 133% and n-2 at 95% of the parent, falling to 25% only at n-3. Thayer attributes this to cross-hybridization of the high-affinity LNA probe and states the consequence: “it is possible that exclusive quantitation of the full-length antisense strand may be overestimated using this method.” Raising probe affinity to gain sensitivity erodes the positional discrimination the ligation step exists to provide. The sensitivity–selectivity trade is usually framed as a choice between formats; here it operates inside one assay.
Thayer’s defense is that truncated siRNA still loads RISC and mediates knockdown, so an assay counting full-length plus n-1 and n-2 may be reporting “a total population of … plausibly active species.” Whether that is the right measurand is a separate question from whether the assay is selective.
Closing the 5′ blind spot. Nothing is ligated at the 5′ end, so nothing tests it. Haegele extended the capture probe with unpaired nucleotides opposite the analyte’s 5′ terminus to present a longer single-stranded region to the S1 nuclease, and found a triethylene glycol spacer was better still: an optimized 31-mer plus an internal Spacer 9 reduced 5′ n-1 cross-reactivity from +10.4–13.7% to −30.8 to −32.7% [13]. The gain “is abolished when diluting out S1 nuclease,” and sensitivity falls with it. Adding 20% (w/v) polyethylene glycol at the ligation step raised background-subtracted signal 50- to 61-fold, which is what made these heavily modified analytes measurable at all.
4. Why electrochemiluminescence (ECL) widens the working range
Traditionally, the read out is generated by alkaline phosphatase conjugated to anti-digoxigenin antibody that dephosphorylates AttoPhos to a fluorescent benzothiazole analog, read after a fixed incubation period. Signal is therefore the product of enzyme quantity and time, accumulating in the bulk solution of the well. Three consequences compress the usable range.
- The top end saturates chemically, not for want of detector range. At high analyte, local substrate is consumed during the incubation and the response falls below proportionality. Accumulated fluorophore also absorbs its own emission once concentrated — an inner-filter effect.
- The lower end is set by background light, not by the label. A fluorescence reading illuminates the whole well and collects from the whole volume. Plate plastic, matrix components and unbound conjugate all contribute emission and scatter, and that floor does not fall as the assay is made more sensitive.
- Time is a variable. Because signal integrates turnover, incubation must be timed precisely and plates read in a narrow window.
Electrochemiluminescence removes all three. The detection reagent carries a ruthenium(II) tris-bipyridine label rather than an enzyme, and the floor of the well is a carbon electrode. Applying a potential in a buffer containing the ruthenium(II) label and tripropylamine oxidizes both species; the tripropylamine radical reduces Ru(III) to an excited Ru(II)* that emits at 620 nm and returns to the ground state, ready to be oxidized again. The ruthenium(II) emits on the order of 105–6 photons per read without being consumed — amplification without an enzyme.
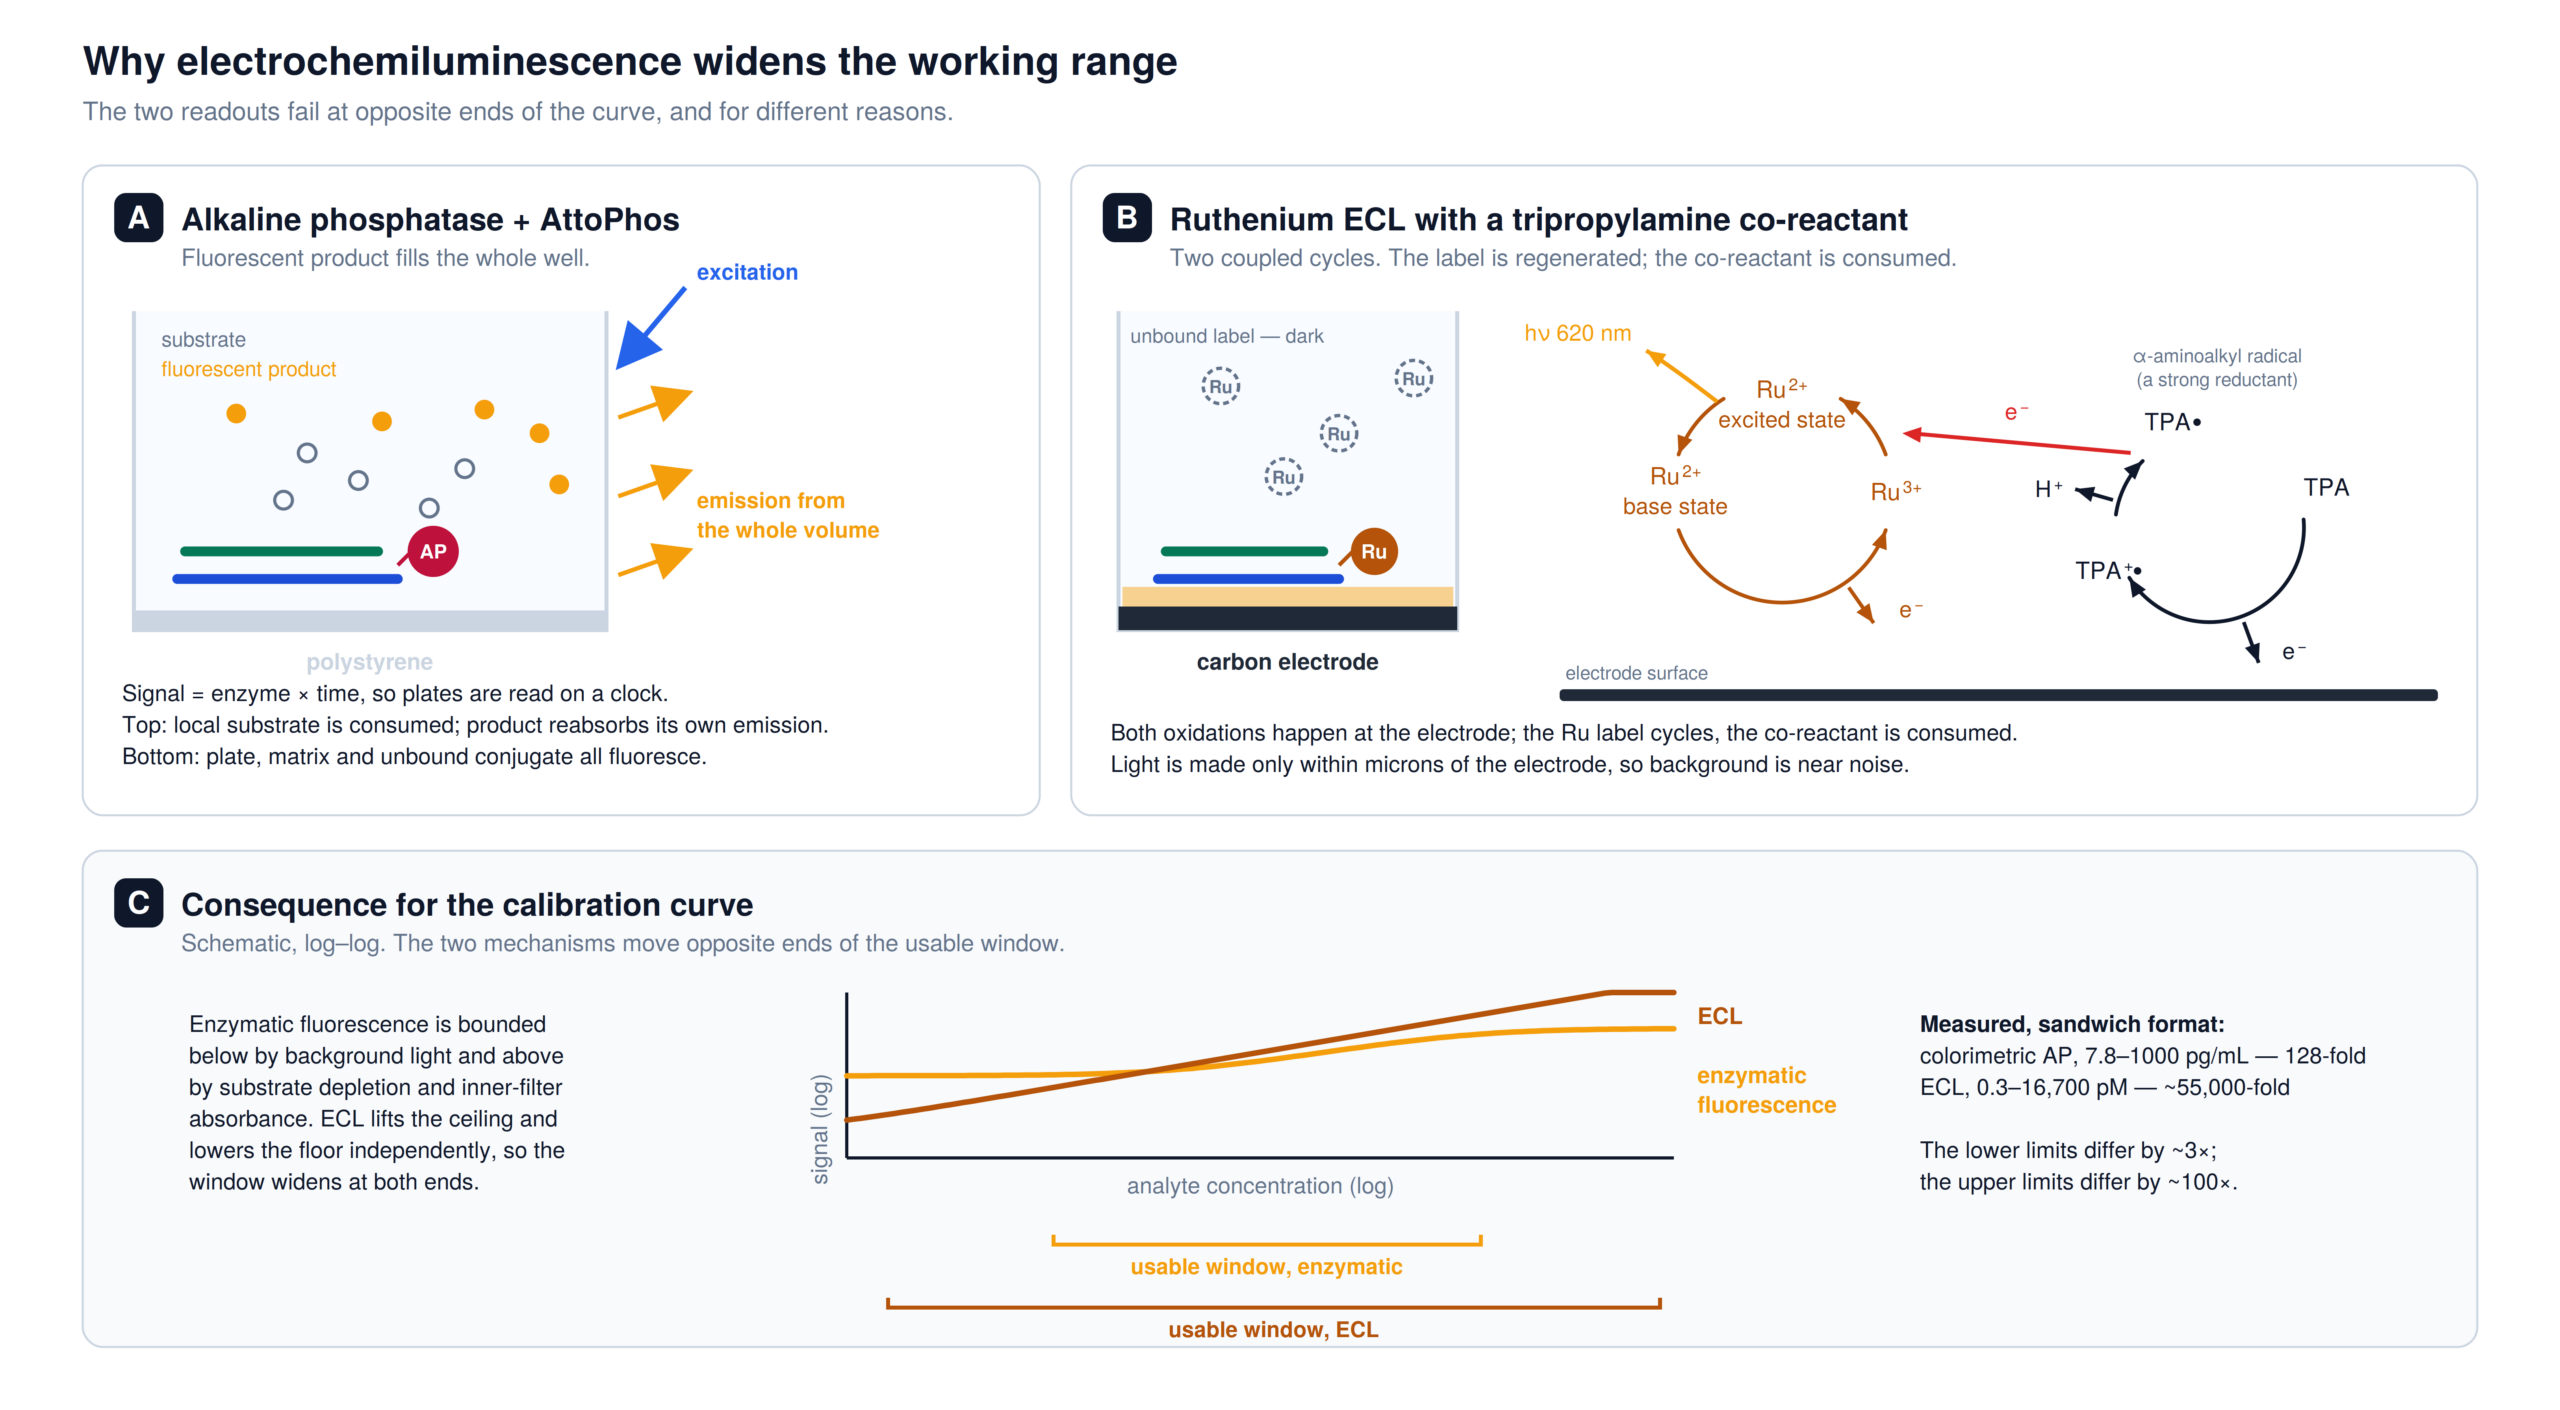
Two properties follow, and they act on opposite ends of the calibration curve, substantially increasing its working range:
- Light is generated only within a few micrometers of the electrode. Label that is not captured at the surface contributes essentially nothing, so background approaches instrument noise. This reduces the lower limit of the range.
- There is no substrate to deplete and no excitation beam. Emission stays proportional to the amount of captured label over orders of magnitude, with no inner-filter effect and no scattered excitation to reject. This raises the upper limit of the range.
Because the two effects are independent, the gain is multiplicative. Thayer’s LNA hybridization–ligation assay on a Meso Scale Discovery (MSD) streptavidin plate spans 0.1–10,000 pM [3]. The enzyme-free POE sandwich on the same platform spans 0.3–16,700 pM, roughly 55,000-fold [10], against 128-fold for Efler’s colorimetric sandwich, which already used LNA probes and already reached about 1 pM [9]. Efler’s LLOQ was only about threefold worse; it is the upper limit that moved by two orders of magnitude. Wide linear range is a property of the readout, not of the probe chemistry, and has made the Meso Scale Discovery platform quite popular.
5. siRNA adds its own competitive inhibitor for analyte capture
Two problems are specific to double-stranded analytes. First, the passenger strand competes with the capture probe. It carries the same sequence as the probe, so it is a direct competitor, and at low temperature the analyte is not available to the probe at all. Yuan quantified this: recovery of a free antisense strand was ≥80% from 22 °C upward, but the same strand within a duplex recovered <5% at 22–40 °C, 10–20% at 50 °C and only reached ~80% at 65 °C with a PNA probe.[5] Recovery of the same strand at the same concentration varies twenty-fold with conformational state. Two consequences invert single-strand practice: recovery halved going from 10 mM to 1 M NaCl because salt stabilizes the therapeutic duplex, and with a DNA probe recovery at the Upper Limit of Quantification (ULOQ) ran ~30% below that at the LLOQ because passenger-strand competition scales with analyte concentration. An uncharged PNA capture probe removed the concentration dependence.
The upper temperature limit is not a hybridization limit. Biotin–streptavidin dissociates above roughly 60 °C [16]; Sips and coworkers measured this directly and found that eluting at 80 °C released capture probe from streptavidin beads in a manner dependent on bead loading rather than probe concentration [17]. Incubating free biotinylated probe with the sample hot and then adding streptavidin beads only after cooling permits capture up to 95 °C.
The two strands must be measured separately. In non-human primate kidney after four weekly doses, the sense strand accumulated at 711.3 ng/mg against 11.8 ng/mg for the antisense strand — a ~60-fold divergence invisible to any single-strand assay [3]. Strand-specific probe pairs are now standard practice for siRNA [10].
6. Branched DNA, briefly
The most sensitive hybridization assay reported for an antisense oligonucleotide is a branched DNA (bDNA) method. Mahajan and colleagues quantified AZD2373, a 16-mer PS ASO, in human plasma at an LLOQ of 31.25 pg/mL (0.03 ng/mL) — a 6.4-fold improvement over the dual-probe electrochemiluminescence assay and 16-fold over the single-probe nuclease-protection ELISA they ran alongside it on the same analyte.[19] The sensitivity comes from amplifying signal rather than analyte. Capture- and label-extender probes bridge the analyte to a plate-bound capture probe and to a branched tree carrying binding sites for hundreds of alkaline-phosphatase-conjugated label probes. Unfortunately, the probe design is proprietary. Mahajan’s capture and label extenders were “designed specifically against” the analyte by the vendor, and no sequences are given. What makes the amplification tree possible is, most likely, Collins’ 1997 work on branching DNA amplification using the non-natural base pair isodC:isodG.[18] The isobases have no significant interaction with any natural nucleotides and prevent any nonspecific hybridization with natural DNA or RNA. It should be noted that there was no testing of metabolite selectivity for n-1mers or n-2mers — only a scrambled sequence.
7. Splint-ligation PCR
The most sensitive platform available uses the analyte itself as a splint: two DNA probes anneal to adjacent regions of the ASO, SplintR ligase joins them, and the ligation product is amplified by TaqMan qPCR.[20] Selectivity comes from the same principle as hybridization–ligation — a nick must be sealed — but detection is exponential rather than stoichiometric.
Jepp adapted this for non-human primate CNS tissue. Working with an 18-mer 3-11-4 LNA gapmer on a fully phosphorothioate backbone, Jepp and colleagues reached 1 pM (0.18 ng/mL) in plasma and 100 pM (18 ng/g) in CNS tissue, with dynamic ranges up to six orders of magnitude.[4]
8. Hybridization coupled to mass spectrometry
Mass spectrometry resolves what hybridization cannot, because it separates species by mass and retention time rather than by annealing. Historically it cost sensitivity. Coupling the two closes that gap: the analyte is captured on a complementary biotinylated probe immobilized on streptavidin beads, washed, then released by heat denaturation directly into an ion-pair reversed-phase LC-MS/MS system. The front end is a ligand binding assay; the back end is a mass spectrometer which easily resolves n-1mers on both the 5′ and 3′ terminus and can even observe deamination events on specific nucleotides.[14]
Using hybridization-coupled mass spectrometry, Pei Li reached LLOQ 0.500 ng/mL from 100 µL of rat plasma and 2.50 ng/g in brain across six matrices with a 1000-fold range.[21] Capture recovery is typically 90–100%, against 60–80% for conventional solid-phase or liquid–liquid extraction, and tissue needed only fivefold dilution in guanidine/Triton lysis buffer.
9. Conjugates measure more than one thing
A conjugate is not one analyte. For an antibody–oligonucleotide conjugate (AOC) the analytes of note are the intact AOC, the free antibody, the antibody-plus-linker and the oligo-plus-linker, and they answer different questions. The choice must be explicit.
GalNAc-siRNA. The conjugate is designed to be cleaved rapidly in hepatocytes to release the unconjugated, pharmacologically active oligonucleotide [22], so free payload is generally the analyte to be measured. Reported approaches are predominantly LC-MS-based; differential protein precipitation with 55% acetonitrile gave >90% recovery of givosiran and inclisiran from rat plasma at single-digit ng/mL LLOQs.[22] GalNAc conjugation generally lowers extraction recovery relative to the unconjugated parent in anion-exchange SPE.[17]
Antibody–oligonucleotide conjugates. Two complementary strategies exist. Hybridization capture with an MS readout quantifies the oligonucleotide component.[23] Immunocapture with an oligonucleotide readout does the reverse: anti-human IgG captures the antibody moiety, heat denaturation at 75 °C releases the antisense strand, and that strand is quantified by IP-RP-LC-MS/MS, so “neither the free antibody nor the free siRNA will be detected”.[24] Elution temperature must be tuned against the siRNA Tm (65 °C gave ~40% recovery, 75 °C 60%, 85 °C 56%), and polyclonal capture reagents vary by lot — three lots of one antibody gave 82%, 51% and 56%.
A sample-preparation trap. Proteinase K, the step that rescues recovery for unconjugated ASO in tissue, manufactures analyte for a conjugate by liberating payload from intact drug. Jiang measured 0.1% conversion during digestion — which at the concentrations dosed corresponds to roughly 200× the LLOQ of free payload [25]. The fix was to remove the digestion: hybridization extraction alone caused no detectable conversion, and recovery without digestion remained above 90% in plasma and 85–93% in brain homogenate. Proteinase K cannot be applied to a peptide or protein conjugates by default.
Peptide conjugates and PMOs. Cell-penetrating peptide–PMO conjugates are quantified by hybridization ELISA adapted for an uncharged backbone.[26] The neutral phosphorodiamidate backbone changes duplex thermodynamics and protein binding — PMOs are typically <50% protein-bound against >85% for phosphorothioates — so selectivity arguments derived for charged backbones require separate derivation.
10. Choosing a platform
Choose against the species that must be distinguished, not against sensitivity alone.
- Profile the metabolites first. Characterize by mass spectrometry while the profile is unknown, then move to a higher-throughput platform once the analytes are defined. The 2002 assumption of 3′-exonuclease dominance in plasma should not be carried into a modified gapmer in CNS tissue.
- Match the enzymatic step to the metabolites that actually form. If 3′ truncation dominates, hybridization–ligation is adequate; if 5′ species are present, engineer the probe or change platform.
- Treat LNA substitution as a trade — sensitivity bought with positional discrimination.
- For duplex analytes, denature thoroughly and reduce ionic strength. Single-strand conditions transfer poorly.
- For conjugates, verify that sample preparation does not liberate payload, and state the measurand.
- Spike standards into unprocessed homogenate. Everything else is downstream of this.
Regulatory guidance remains platform-agnostic: the FDA’s 2024 document asks only that “appropriate bioanalytical methods should be used to characterize the parent oligonucleotide and any relevant metabolites if applicable,” deferring to ICH M10 [1], which has no oligonucleotide-specific provisions. A 2026 AMED consensus paper is the first to adapt those validation parameters for oligonucleotides and covers hybridization extraction explicitly;[27] recommendations for antibody–oligonucleotide conjugates appear in the 2025 WRIB white papers.[28]
11. Conclusion
A hybridization assay reports the amount of material in the homogenate that anneals to the probe and survives the format’s discriminating step. For a full-length analyte with no metabolites present, that is the drug concentration. In a real biodistribution sample, it is a weighted sum across chain lengths and chemical forms, and the weighting is set by where the enzymatic step acts.
Hybridization–ligation with S1 nuclease and an ECL readout is the workhorse for single-stranded analytes; the enzyme-free sandwich is preferred where enzyme lot variability or heavily modified chemistry makes ligation unreliable, at a known cost in selectivity. Splint-ligation PCR is the option when tissue is scarce and sensitivity is paramount. Hybridization-coupled mass spectrometry is what to reach for when the question is which species, not how much. Most programs will need more than one approach to fully characterize the tissue distribution of the NAT and its metabolites.
References
- US Food and Drug Administration, Center for Drug Evaluation and Research. Clinical Pharmacology Considerations for the Development of Oligonucleotide Therapeutics — Guidance for Industry. June 2024.
- Crooke RM, Graham MJ, Martin MJ, Lemonidis KM, Wyrzykiewiecz T, Cummins LL. Metabolism of antisense oligonucleotides in rat liver homogenates. J Pharmacol Exp Ther 2000;292(1):140–149.
- Thayer MB, Lade JM, Doherty D, Xie F, Basiri B, Barnaby OS, Bala NS, Rock BM. Application of locked nucleic acid oligonucleotides for siRNA preclinical bioanalytics. Sci Rep 2019;9:3566.
- Jepp T, Christian S, Dindot SV. Antisense oligonucleotide quantification via splint-ligation PCR assay in nonhuman primate central nervous system tissues and biofluids. Nucleic Acid Ther 2026;36(1):37–46.
- Yuan L, Dupuis J-F, Mekhssian K. A novel hybridization LC-MS/MS methodology for quantification of siRNA in plasma, CSF and tissue samples. Molecules 2023;28(4):1618.
- Ranki M, Palva A, Virtanen M, Laaksonen M, Söderlund H. Sandwich hybridization as a convenient method for the detection of nucleic acids in crude samples. Gene 1983;21(1–2):77–85.
- Yu RZ, Baker B, Chappell A, Geary RS, Cheung E, Levin AA. Development of an ultrasensitive noncompetitive hybridization–ligation enzyme-linked immunosorbent assay for the determination of phosphorothioate oligodeoxynucleotide in plasma. Anal Biochem 2002;304(1):19–25.
- Wei X, Dai G, Marcucci G, Liu Z, Hoyt D, Blum W, Chan KK. A specific picomolar hybridization-based ELISA assay for the determination of phosphorothioate oligonucleotides in plasma and cellular matrices. Pharm Res 2006;23(6):1251–1264.
- Efler SM, Zhang L, Noll BO, Uhlmann E, Davis HL. Quantification of oligodeoxynucleotides in human plasma with a novel hybridization assay offers greatly enhanced sensitivity over capillary gel electrophoresis. Oligonucleotides 2005;15(2):119–131.
- Thayer MB, Humphreys SC, Chung KS, Lade JM, Cook KD, Rock BM. POE immunoassay: plate-based oligonucleotide electro-chemiluminescent immunoassay for the quantification of nucleic acids in biological matrices. Sci Rep 2020;10:10425.
- Tremblay GA, Khalafaghian G, Legault J, Nielsen P, Bartlett AJ. Dual ligation hybridization assay for the specific determination of oligonucleotide therapeutics. Bioanalysis 2011;3(5):499–508.
- Deverre JR, Boutet V, Boquet D, Ezan E, Grassi J, Grognet JM. A competitive enzyme hybridization assay for plasma determination of phosphodiester and phosphorothioate antisense oligonucleotides. Nucleic Acids Res 1997;25(18):3584–3589.
- Haegele JA, Boyanapalli R, Goyal J. Improvements to hybridization-ligation ELISA methods to overcome bioanalytical challenges posed by novel oligonucleotide therapeutics. Nucleic Acid Ther 2022;32(4):350–359.
- Li J, Liu J, Enders J, Arciprete M, Tran C, Aluri K, Guan L-H, O’Shea J, Bisbe A, Charissé K, Zlatev I, Najarian D, Xu Y. Discovery of a novel deaminated metabolite of a single-stranded oligonucleotide by mass spectrometry. Bioanalysis 2019;11(21):1955–1965.
- Agrawal K, Calliste LK, Ji S, Xu S, Ayers SA, Jian W. Comparison of multiple bioanalytical assay platforms for the quantitation of siRNA therapeutics. Bioanalysis 2024;16(13):651–667.
- Holmberg A, Blomstergren A, Nord O, Lukacs M, Lundeberg J, Uhlen M. The biotin-streptavidin interaction can be reversibly broken using water at elevated temperatures. Electrophoresis 2005;26(3):501–510.
- Sips L, Ediage EN, Ingelse B, Verhaeghe T, Dillen L. LC-MS quantification of oligonucleotides in biological matrices with SPE or hybridization extraction. Bioanalysis 2019;11(21):1941–1954.
- Collins ML, Irvine B, Tyner D, Fine E, Zayati C, Chang C, Horn T, Ahle D, Detmer J, Shen L-P, Kolberg J, Bushnell S, Urdea MS, Ho DD. A branched DNA signal amplification assay for quantification of nucleic acid targets below 100 molecules/ml. Nucleic Acids Res 1997;25(15):2979–2984.
- Mahajan S, Zhao H, Kovacina K, Lachacz E, Hoxha S, Chan J, Liang M. High-sensitivity quantification of antisense oligonucleotides for pharmacokinetic characterization. Bioanalysis 2022;14(9):603–613.
- Shin M, Meda Krishnamurthy P, Devi G, Watts JK. Quantification of antisense oligonucleotides by splint ligation and quantitative polymerase chain reaction. Nucleic Acid Ther 2022;32(1):66–73.
- Li P, Gong Y, Kim J, Liu X, Gilbert J, Kerns HM, Groth R, Rooney M. Hybridization liquid chromatography–tandem mass spectrometry: an alternative bioanalytical method for antisense oligonucleotide quantitation in plasma and tissue samples. Anal Chem 2020;92(15):10548–10559.
- Yuan L. Hybridization liquid chromatography-mass spectrometry for quantitative bioanalysis of oligonucleotides: the upcoming paradigm shift. J Chromatogr A 2025;1766:466575.
- Guimaraes GJ, Jiang T, Bajrami B, Yuan L. Hybridization LC–MS/MS: an alternative platform to enable specific and sensitive quantification of antibody–ASO conjugates. Anal Chim Acta 2026;1416:345757.
- Song Z, Yuan L. A novel hybrid LC-MS/MS methodology for the quantitative bioanalysis of antibody-siRNA conjugates. Anal Chem 2025;97(36):19570–19577.
- Jiang D, Li P, Yuan L. Bioanalysis of free antisense oligonucleotide payload from antibody–oligonucleotide conjugate by hybridization LC-MS/MS. Bioanalysis 2024;16(15):791–800.
- Burki U, Keane J, Blain A, O’Donovan L, Gait MJ, Laval SH, Straub V. Development and application of an ultrasensitive hybridization-based ELISA method for the determination of peptide-conjugated phosphorodiamidate morpholino oligonucleotides. Nucleic Acid Ther 2015;25(5):275–284.
- Sun Y, Saito K, Nitta S-I, Goda R, Kishino Y, Fujita H, et al. Development and validation of LC-MS-based bioanalytical methods for oligonucleotide therapeutics: points to consider. Drug Metab Pharmacokinet 2026;70:101545.
- Wojcik J, Qian M, Rosenbaum AI, Maes E, Xue Y, Kochansky C, et al. 2025 White Paper on Recent Issues in Bioanalysis: bioanalysis of antibody-oligonucleotide and bicycle drug conjugates; recommendations on mass spectrometry assays, chromatography, sample preparation and regulated bioanalysis. Bioanalysis 2026;17(24):1605–1654.